


Complete carbon cycle tracking
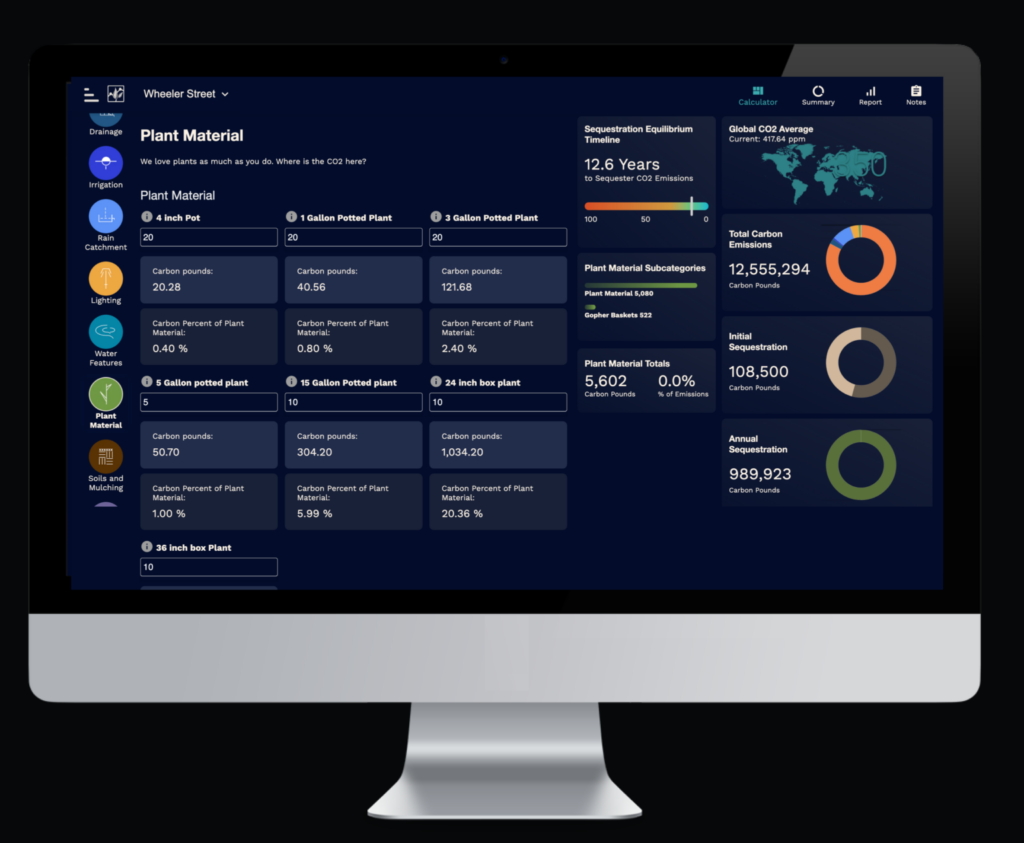
This is your tool to calculate emissions at the granular level. From 36“ box trees to individual drip emitters. This calculator gives you a detailed view of emissions so you can more effectively meet your goals.
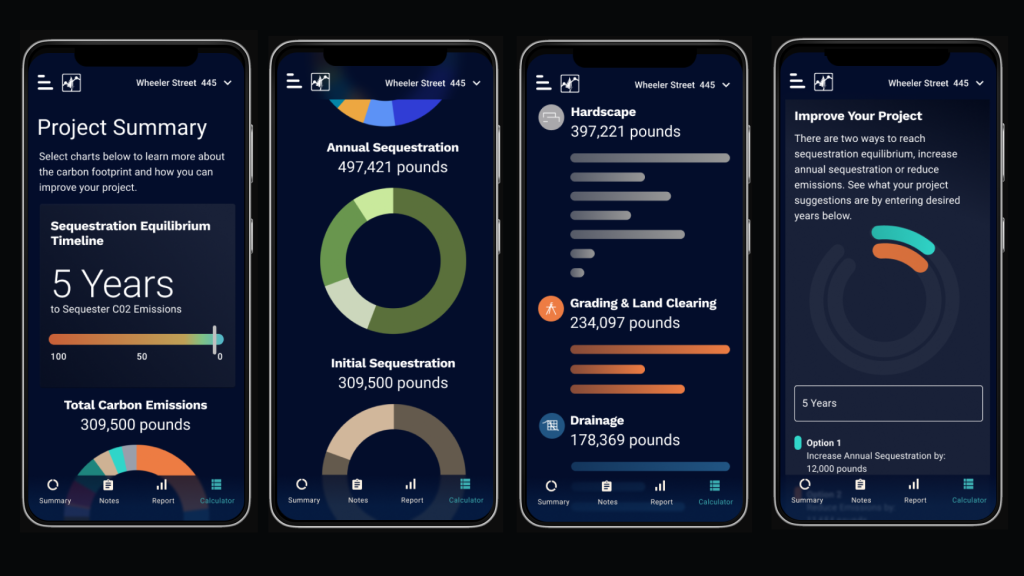
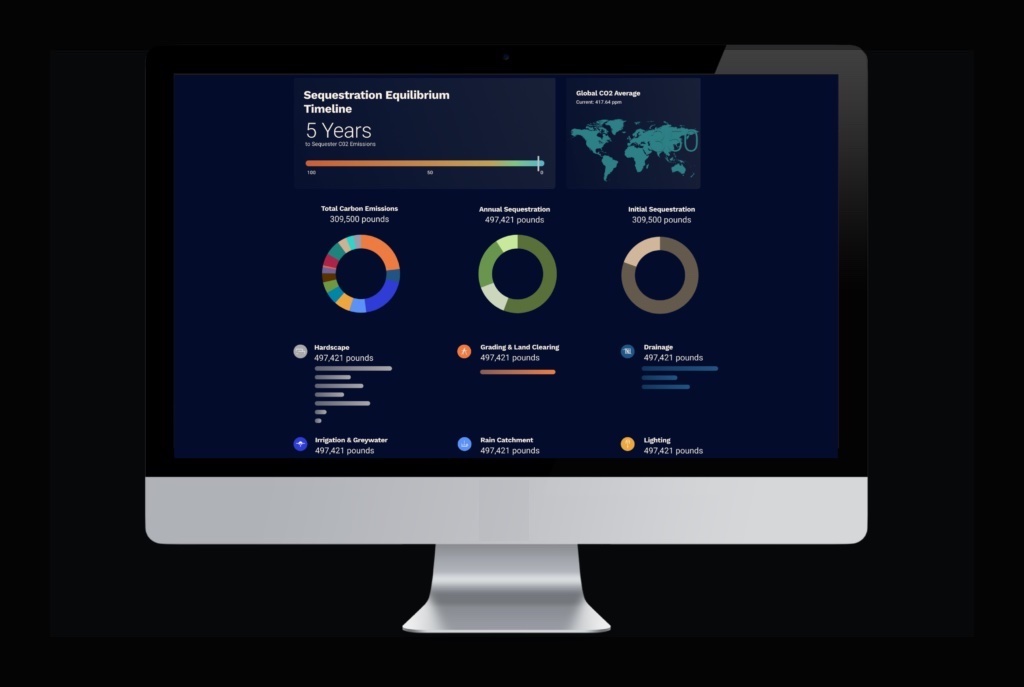
Sequestration Equilibrium Timeline
We need to track more than emissions. We need to track what we sequester! Enter the square footage of your landscape into 4 different plant categories to calculate how much carbon your landscape will sequester per annum. We will do the math and provide you with a chart that displays how long your landscape will take to sequester the carbon emitted to build it.

Be part of the global
climate solution
With over 300 input groups, Bond not only tracks your carbon footprint at a very granular level, but also your sequestration capabilities so you can determine how long your project will take to reach equilibrium and become part of the global climate solution. Check out the data categories we measure below.
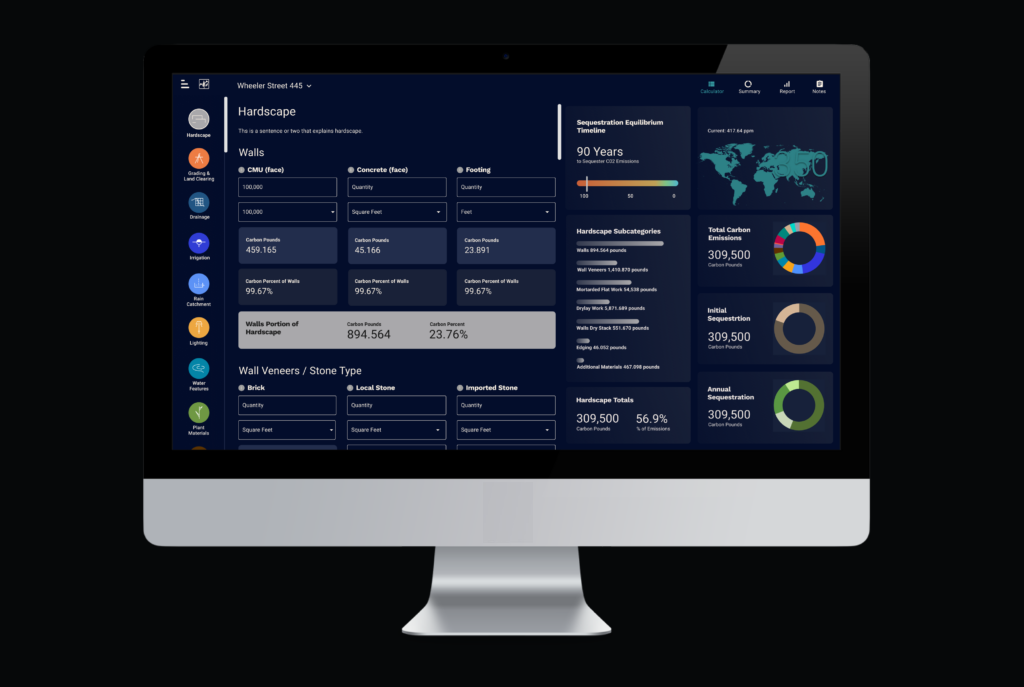
Hardscape
Calculate the materials for walls, edging, flatwork, and more.
Grading and Land Clearing
CO2 is released from soil and plant material during these activities.
Drainage
Add up everything from your drainage inlets to your aggregates.
Irrigation & Greywater
Track piping, infrastructure, and drip materials.
Rain Catchment
Validate tank, plumbing, and pump materials.
Lighting
Add up your fixtures, wires and other materials.
Water Features
Plants, pumps, plastic and stone, it all adds up.
Plant Material
We love plants as much as you do. Where is the CO2 here?
Soils and Mulching
Even soils and mulch have a CO2 footprint.
Transportation
The footprint isn’t accurate without calculating the construction vehicles.
Deliveries
Let’s include the gas and diesel-powered vehicles used by your suppliers.
Equipment
We can track everything from a battery-powered trimmer to diesel heavy equipment.
Sequestration
Track the sequestration capabilities of all of your planting areas and plant types.
Clear graphics to see the whole picture
Each input category has its own page and associated bar chart. This allows you to see your results, graphically and in real-time.
Export graphs & charts
Every graph and chart is exportable in multiple different file types. This allows you to create your own customized report, helping to set you apart in your field.
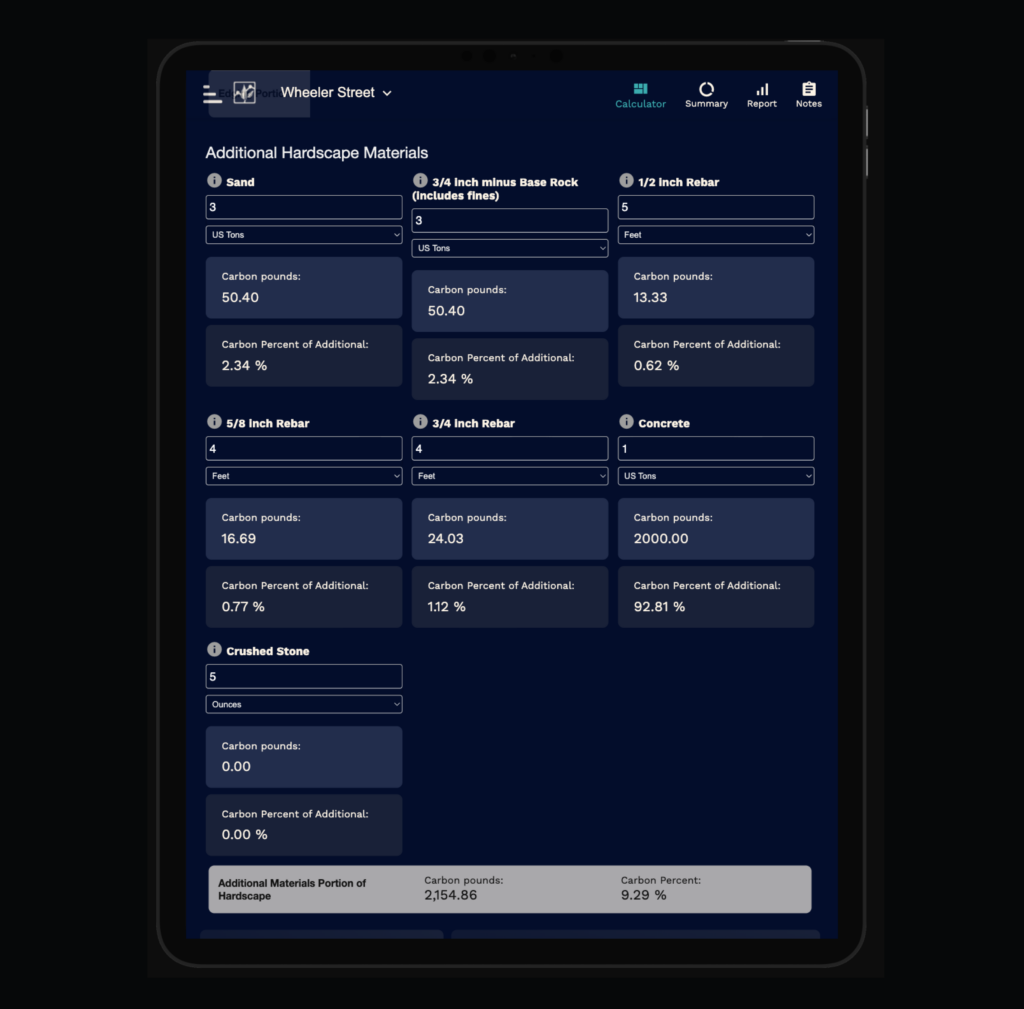
Supported Infrastructure
For your walls and dry lay flatwork, we have included your supporting infrastructure. From sand and base to concrete and rebar, it’s all included. If you want to build it differently or add more material, there is an additional materials section for you to customize.
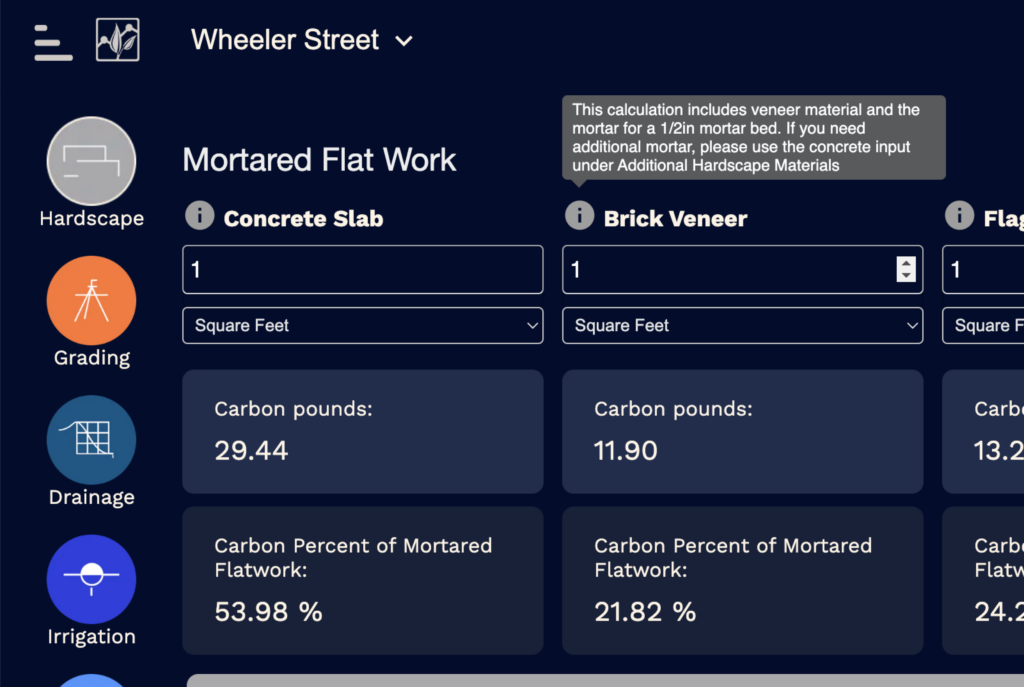
Built-in Tips
Next to each input, we have placed tips , reminders, or additional instructions to help you understand the input and keep you moving efficiently and confidently through your work.